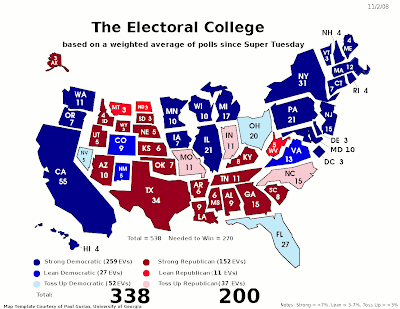
Tag Archives: information graphics

baby names cartograms chartjunk election results electoral college Google Google Finance Google Spreadsheets information design internet Map App of the Day maps poll presidential election stock charts time series chart

Map App of the Day: Presidential Election Maps

It’s just two days until the U.S. Presidential election.  I thought I’d talk a bit about how elections are covered with information graphics, specifically maps.

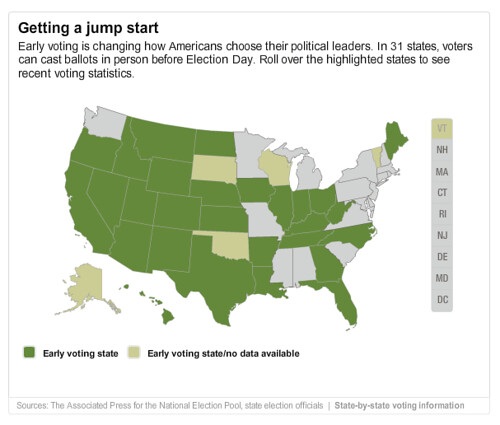
To get things started, CNN has has a map of early voting participation numbers.  For some states, they even have participation by party and by county.  This particular map is disappointing – no real effort is made to illustrate the information, all the real data is just text in callout boxes.  It might even be more efficient just to put the data in a big table like this page at George Mason University.

cnn-early-vote

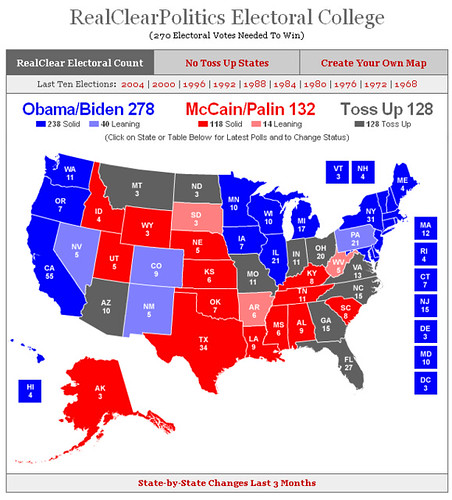
Real Clear Politics’ mapping application is interesting because it gives you to ability to run your own scenarios, switching swing states back and forth to see the result. You can also compare results from previous elections, all the way back to 1968.

real-clear-politics-map

But geographic projections don’t tell the whole story –  Political Irony has a great map demonstrating exactly why the Electoral College is a terribly undemocratic way to choose a president – voters in some states have effectively four times the influence of voters in others:

I’m not the first person to notice this of course, so there have been many efforts to show cartograms based on electoral pull.  There’s one at the Dispassionate Liberal and one at American Street, both using data from Pollster.com.

I like the analysis at FiveThirtyEight.com a little better, so I’ll show the latest cartogram from Frontloading HQ:

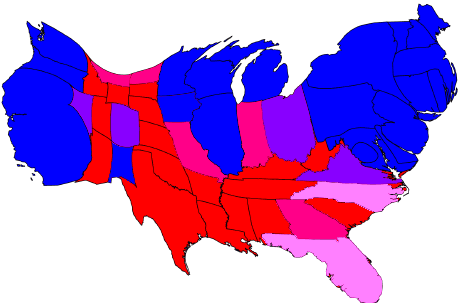
This map tries to keep the states in the right shapes, if they’re a bit disconnected.  Taking a cue from Michael Gastner, Cosma Shalizi, and Mark Newman at the University of Michigan, here’s a cartogram using the current data from FiveThirtyEight:

fivethrityeight election polling cartogram

A couple of notes – Blue is safe for Obama, Red is safe for McCain.  I compressed “leans” and “likely” categories into one color because it’s late and my eyes are tired.  Also, I’m missing Alaska and Hawaii, I’ll try to find a base map that has them and update.

By the way, here’s another page with interesting maps of 2004 election results analyzed in a number of interesting ways.

I’m still on the lookout for the best map to watch election results as they come in on Tuesday – any suggestions?
Google Spreadsheets Time Series Chart of Baby Name Votes

Here’s a time series chart of the first 1000 votes in our baby name poll. This shows vote totals over time using the exact same interface as the stock charts in Google Finance.

EDIT: Well, it turns out I made some pretty crazy formulas and broke my own charts. I’ll have an update soon to tell you how to make cool charts and how not to break them. The voting form works, though, so don’t be afraid to contribute.

EDIT: the chart is a little hard to read in my narrow blog format, here’s a link to the full-sized version.

The first jump on September 8th came from sending out the link to friends and family via email, through my blog, and over Facebook. The second jump, starting after 5 p.m. or so, came from an internal mailing list at work. From there the votes slowly accumulated until October 2nd, when this was featured in the internal news at work. The poll has been picked up on a couple of forums and websites now, which probably accounts for the rate increase on the 3rd.

How did I create the chart? On your spreadsheet, click the “Insert Gadget” link and choose Interactive Time Series Chart. You’ll need at least two columns, one with the timestamps from your form, and another with the vote count. Since every row represents a vote, I just used the ROW() function in the second column to get the count.

I’m still working on getting it to update automatically as new votes come in, and I’ll also see if I can get the graph to show lines for each name to see relative popularity over time.

Internet Baby Naming Update

Friends, family, my co-workers at Google, and random strangers on the internet have contributed more than 500 votes for our kid’s name. At this point we have some clear favorites, with Dylan leading the boys chart and Olivia and Ada pulling ahead on the girls chart.

I’ve decided to move all the charts to this post, I’ll try to add updates with more detail as time goes on.

First, the graph of the most popular Girls’ names:

EDIT: Well, it turns out I made some pretty crazy formulas and broke my own charts. I’ll have an update soon to tell you how to make cool charts and how not to break them. The voting form works, though, so don’t be afraid to contribute.

DOUBLE EDIT: I’ve put in static versions of the charts while I work on fixing my spreadsheet.

Here’s the graph of the most popular Boys’ names:

Here’s a familiar, if not cognitively optimum, pie chart showing who has been voting:

Just for fun, here are graphs of some of the leading names’ popularity since the 1880s from the wonderful Baby Name Wizard website.

The only problem with these graphs is that they don’t give an identifiable scale. So, you can’t easily compare the different name graphs below – note that the darker the hue, the more babies had that name.

Olivia:

Popularity of names starting with OLIVIA

OLIVIA

Continue reading